Baltimore City Industries
This is a super simple entry level project that I did that shows some skills with SQL. Using simple queries can help simplify large datasets as well as help navigate to certain information that is needed. In this case, I simply wanted to know where the concentration of industrial businesses with buildings worth more than $500,000 were located. This same method can be used to look at any other census data like residential or state information.

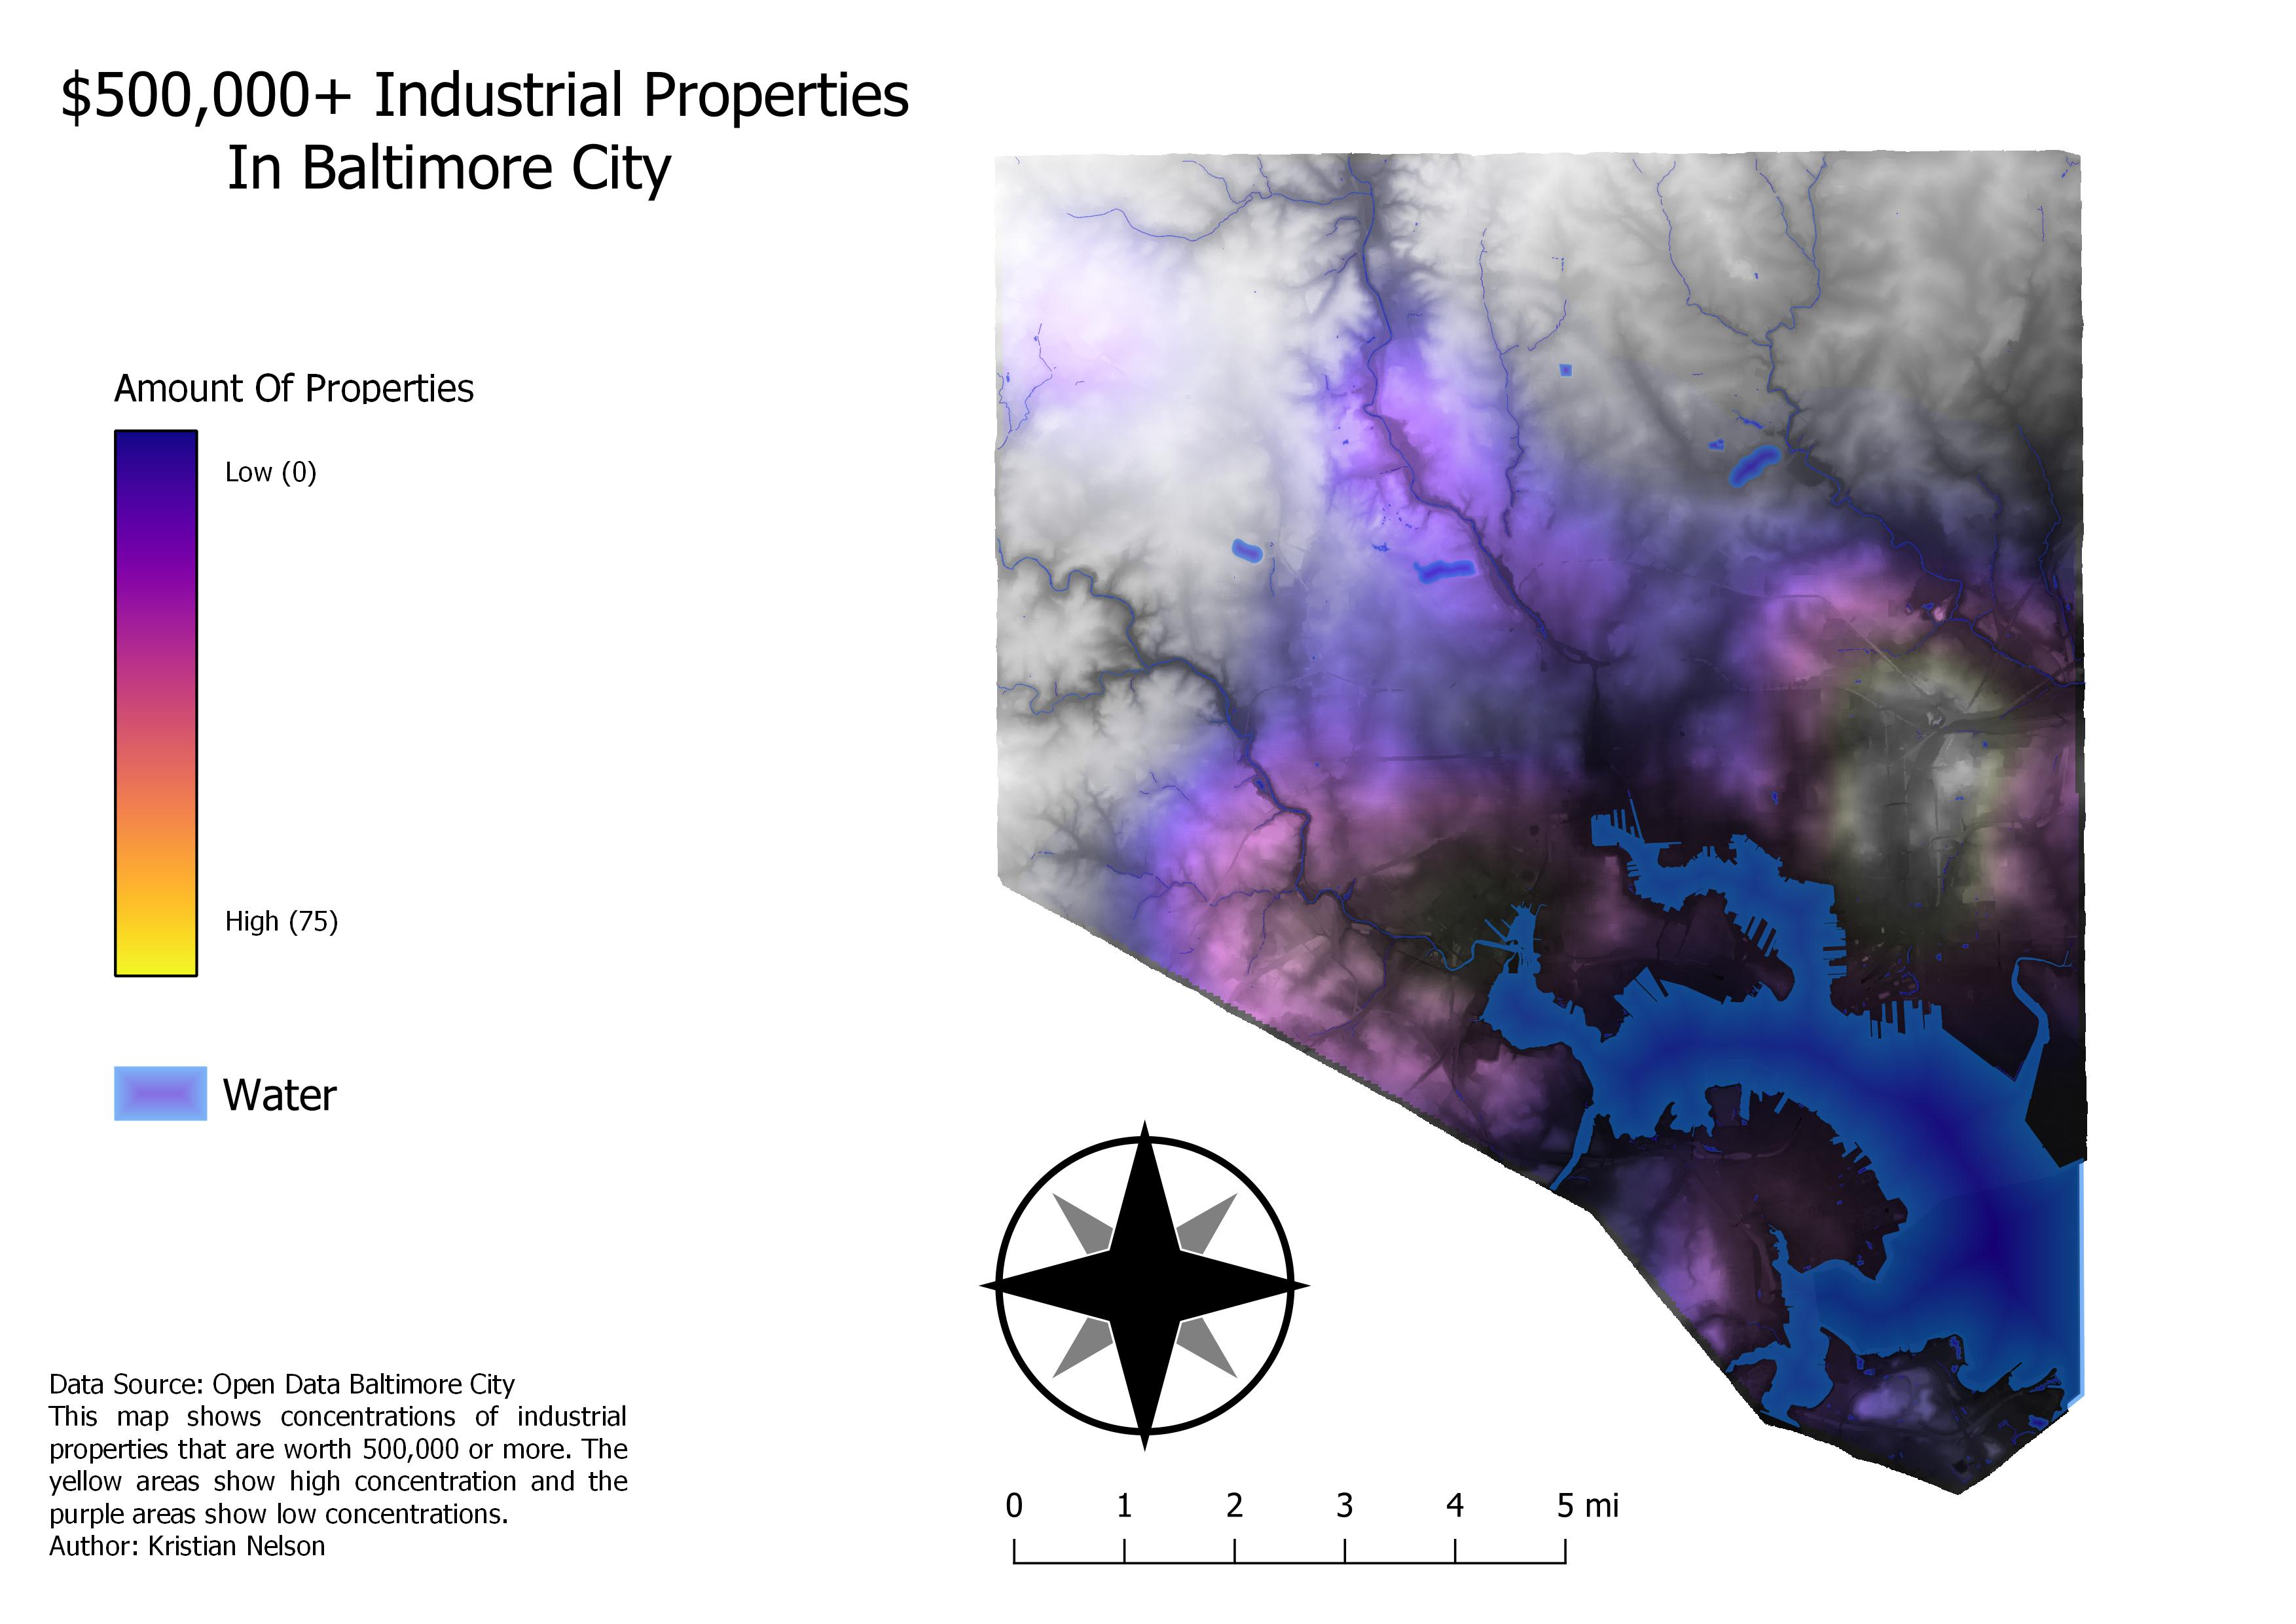
This map shows the concentration of industrial properties worth over $500,000 in Baltimore City. The map shows that there is a very high concentration of businesses that fit this description over on the southeastern side of Baltimore. It is also shown that there are a number of industrial properties worth this much located around the main rivers and bodies of water. As you get farther away from the water’s edge, the amount of industrial properties of this value decrease.

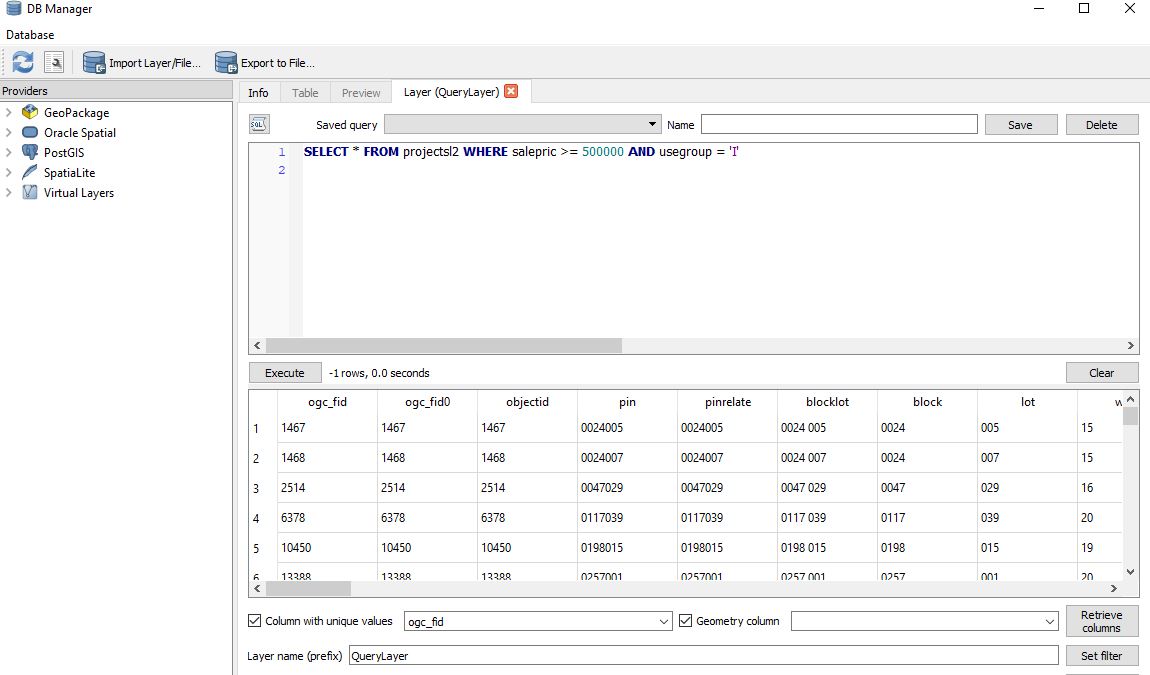
This data was retrieved from the Real Property Dataset found on the Baltimore City Open GIS Data website. The dataset was converted to a Spatial Lite database, and a SQL query was used to single out the industrial properties that were worth $500,000 or more. The query is shown in the image above.

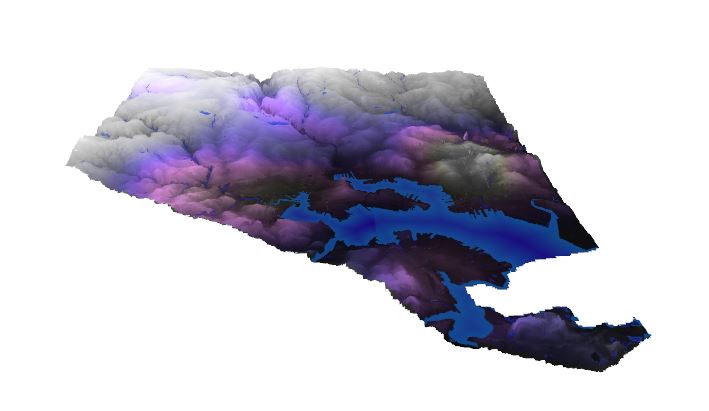
The image above is a 3D visual of the $500,000+ Industrial Properties map. This image helps emphasize the decrease in elevation towards the waters edge, which is also where you see a lot of these industrial properties.
Languages: HTML, Markdown
Applications: QGIS, ArcMap, Atom
Projection: NAD 1983 State Plane Maryland 1900 Ft.
Data Source: Baltimore City Open GIS Data, MD iMap
Cover photo retrieved from: Monster Displays